Posts

Showing posts from April, 2015

Dungiven Priory, Co Derry±London

Image
 [** If you like this post, please make a donation to the IR&DD project using the secure button at the right. If you think it is interesting or useful, please re-share via Facebook, Google+, Twitter etc. To help keep the site in operation, please use the Amazon search portal at the right - each purchase earns a small amount of advertising revenue **] < 3D images | O’Cahan Tomb > During the spring of last year (April 2014) I was coming home from a work engagement in West Ulster. The early evening was bright, the skies were blue, the weather was just lovely – hardly a breath of wind in the air. I was contemplating that the next town on my drive would be Dungiven. It then struck me that in all my time as a professional archaeologist, I’d never stopped to see Dungiven Priory. At one time my work would frequently take me out this direction, but I was always in too much of a rush to get there in the morning, or get home at night, to stop. Confirming in my head that I di

Dungiven Priory, Co Derry±London | O’Cahan Tomb

Image
< Back to main post | 3D images > As I mention in the main post, these rather excellent photos of the O’Cahan tomb (and other items within the chancel area) were taken by Ed Feeny and used with permission. < Back to main post | 3D images >

Dungiven Priory, Co Derry±London | 3D images

Image
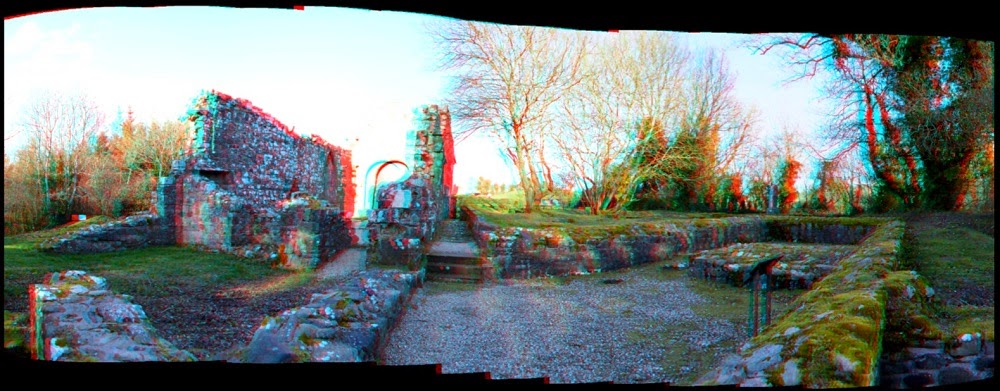
< Back to main post | O’Cahan Tomb > Once again, I’ve been out combining my love of archaeology with 3D (anaglyph) photography – and these are the, somewhat variable, experimental results. Information on glasses and other 3D images in this blog may be found here . Click for larger images. < Back to main post | O’Cahan Tomb >

Corners of foreign fields: Visualising the human cost of the Great War (1914-1918)

Image
For this project, I wanted to see how I could use the mapping functionality within Tableau to visualise the battle sites and casualties of World War I. As my primary data source, I’ve used the Wikipedia article List of military engagements of World War I , and references therein. The article is quite good, and provides a structured list of Fronts, Theatres, and Campaigns, with individual battles and actions listed within these sections. I wanted to see if I could extract the baseline data from the text and reconfigure it into a more visual entity, with a degree of interactivity that would allow the user to create their own visualisations , based on all or subsets of the data. [Can't wait to explore the data? Scroll to the end of the post, or go direct to my Tableau page: here ] Within each action, I have gone to the appropriate Wikipedia Page and extracted the following information: Front/Campaign; Action; date (start & end); the location (converted to decimal Latit