‘The excavation was a financial success’ | Irish Commercial Archaeology in 2015
 |
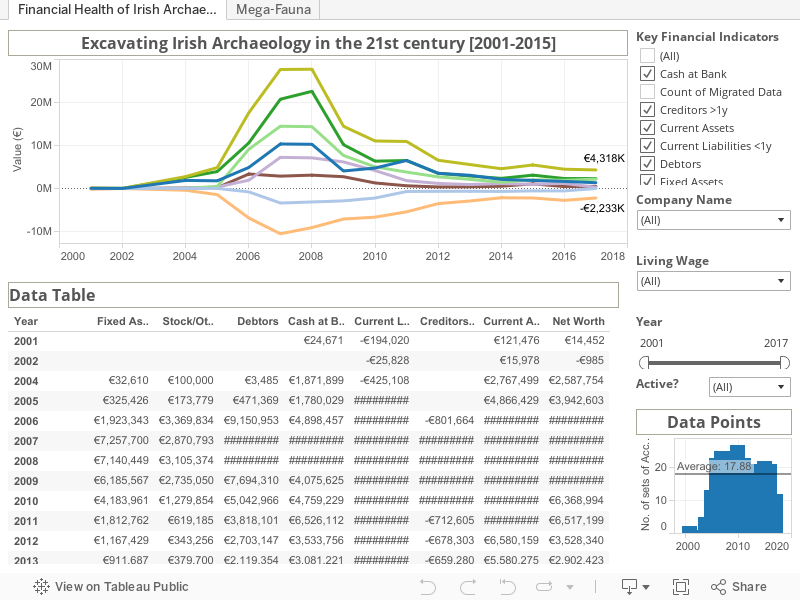
| Screenshot of the Tableau Dashboard. Available [here] and at the end of this post |
Background
Archaeologists are
supposed to be rather good at digging … out in the field it’s quite a bit of
what we do. When I left field archaeology in 2011 it was, I suppose, inevitable
that I would find something else to delve and dig into. One of the topics that
has engaged my attention in recent years is the reconstruction of the financial
histories of individual archaeological consultancies to create an impression of
the sector as a whole, based on a few publicly available ‘Key Financial
Indicators’. The process started with an examination of Northern Ireland’s four
archaeological consultancies for the period from 2007-2013 [here]
and, while imperfect, was sufficient to plot much of the post-2008 collapse of
the industry, even if the 2013 data was only for a single company. A second
post [here]
updated the dataset with the 2013 financial details of two further companies.
My original point in this was to demonstrate the financial fragility of the
sector and underline the dangers this posed for excavated archives, should one
or more company declare bankruptcy. The approach proved popular with many
archaeologists (though perhaps not with the company owners themselves) and I
was prevailed upon to extend my analysis to companies in the Republic of
Ireland [here].
At that time, the data ran from 2001 to 2014. It was at this point I also introduced
the use of Tableau dashboards that allowed the user to interact directly with
the data and create their own dynamic visualisations. An advantage of this was
that it allowed the user to replicate and interrogate my methods, along with
allowing them to drill down to the information most pertinent to their own
interests. In a further post [here]
I updated the Northern Ireland story to include 2014 data. I then took the
decision to pay for access to the Summary Accounts submitted by individual
companies to Companies House. Although relatively expensive, the access allowed
me a more granular view of the individual accounting categories that made up
the high level KFIs. It also gave me the opportunity to extend the historical
view back to 1998 (and for one company, up to 2015), thus charting the rise of
the commercial archaeological sector as well as its fall. My most recent work
on the topic [here]
has expanded the Northern Irish dataset to include 2015 results for two further
companies. For this iteration of the report I was persuaded to drop my earlier
attempts at obfuscation and name actual companies. All this concentration on
the Northern Irish scene has reminded me that I have neglected the financial
landscape of the Republic of Ireland. This post seeks to remedy that situation.
What’s New?
Following the precedent
set in the last update of the Northern Irish data, this iteration of the
dashboard will no longer use a Three Letter Acronym (TLA) to obfuscate the
names of the companies. The actual company name will appear in the Company Name
filter, if occasionally shortened to fit the space available. The list of Key
Financial Indicators has been expanded from four to eight, the same as the NI
dataset. While I felt that there was much to recommend the graph of Average
Values, it was very small and difficult to read. For this reason I have dispensed
with it entirely, to free up space for the expanded data table. The Data Points
graph, indicating the numbers of accounts submitted per year, while valuable,
didn’t need quite so much space to be effective. It has been moved to the
bottom right-hand corner, again, to provide more space for the data table. The
calliper filter to select the Year, and the dropdown to switch between the
active and inactive companies (or both together) remain. However, a new Living
Wage filter has been added. This allows the user to exclude/include companies
that have agreed or refused to sign up to the Living Wage initiative. A third
category exists for companies who have yet to be contacted for a response.
Finally, available accounts for the Galway-based Arch Consultancy run from 2005-2103, but were not previously in the
dataset. Previous iterations of the dashboard have been confined to a single
tab, but here I’ve added a second (termed Mega-fauna) to examine the unequal value
of One Company against Everyone Else in the sector.
The 2015 Data
Some 20 companies
submitted 2014 accounts that are available to me. For 2015 this number dropped
to 18. Four of these companies did not (or have not yet) submitted 2015
accounts: Lane Purcell Archaeologists; Association of Archaeological
Consultants of Ireland; Eachtra Archaeological Projects; Moore Archaeological
and Environmental Services. Of these, Lane Purcell Archaeologists have
submitted a Request for a Voluntary Strike Off and may be considered to have
ceased trading, though they have not formally been dissolved. The Association of
Archaeological Consultants of Ireland company have now been dissolved. In the
previous iteration of this dataset, 2013 was the last year I had summary
accounts for Moore Archaeological and Environmental Services. This has now been
updated to include 2014. Interestingly, this company was dissolved in May 2016,
but applied for restoration in July 2016. Two further companies submitted their
first sets of accounts in 2015: Shanarc Archaeological Consultancy and Archaeological
Service Providers.
Archaeological
Development Services last submitted accounts in 2012 and have a number of
documents on file regarding the liquidation of the company. However, for
whatever reason, they appear to still be considered as active by Companies
House and I have (not without reservations) mirrored that designation. The
previous version of the dataset contained 2015 accounts for Valerie J Keeley
and these (obviously) are retained. This company too is listed as Active, but
the documentation includes notices of Voluntary Winding Up and the appointment
of a Liquidator.
Analysis
As there are too many
companies in the RoI dataset, I don’t propose going through them one by one, as
I did for the NI consultancies. Instead, I want to look at overall figures and
trends about how the sector is performing as a whole. Anyone interested to
examine the changing fortunes of any company at an individual basis will find
the tools to do so on the dashboard.
As I have done before, the
discussion will include data only from companies still considered commercially active.
Although I recognise that this somewhat limits the full historical perspective,
it does have the advantage of centring the discussion on only those entities
actively excavating sites and providing employment. In terms of Fixed Assets,
2015 saw a slight decrease in value from €1.13M to €941K.
It is broadly in line with the €911K recorded in 2013, and while it
represents some form of short-term stability and continuity, it is indicative
of a lack of recovery from historic highs of €6.9M recorded in 2007. The
Stock/Other category includes investments and works in progress and can
incorporate some rather disparate assets that are hard to otherwise categorise.
That caveat aside, it is clear that this category has shown a remarkable
increase to €1.06M in 2015, up from €0.5M the previous year, and the historic
low of €343K in 2012. Once again, the figure is well below the historic highs
of nearly a decade previously when the total hit €3.2M in 2006. Debtors also
show a healthy increase in 2015 to €1.86M, from a 2013 low of €1.21M. This is
well below historic highs of €9.98M and €10.3M in 2007 and 2008, respectively.
Debtors are an interesting and, potentially, double-edged category as the
figure records work billed for, but as yet unpaid. It’s money that (all things
being equal) is coming your way, but you don’t actually have it in the bank. In
a healthy financial environment, this should be only a minor consideration, but
in less certain economic times it is eminently possible that such funds may
never materialise. This may be either be through the debtor being unwilling or
unable to pay, leaving the company with a reduced cash flow and, in turn,
unable to pay their own debts. I will return to this point in due course. For
the moment, looking at Cash at Bank, 2015 appears to have been a relatively
successful year with a total of €2.83M recorded, up from €2.10M in 2014, and
broadly comparable to 2013s €3.08M. While a strong performance, the figures are
well down from historic highs of €5.12M in 2007 and €6.52M in 2011.
One of the advantages of access to the
summary accounts, rather than just the high level KFIs, is that it allows us
see how creditors can be broken out into two sub-categories – those that are
payable within the coming year and those that are payable within a timescale
greater than one year. The Current Liabilities payable within the coming year
were recorded at -€2.05M in 2015. This is an improvement on the -€2.18M from
the previous year, and significantly better than 2007s historic highs of -€9.75M.
Creditors to be repaid outside of the current year usually includes business
loans and the like. In 2015 this figure was recorded at -€571K and has remained
relatively consistent since 2011s total -€712K. These figures represent a
significant recovery from the high of -€3.4M returned for 2007. Gross Current
Assets would, ostensibly, read like a good news tale of recovery in 2015 to
€5.73M from a low the previous year’s total of €4.05M. It may even be hailed as
the first step back after a seven-year decline from 2007s record €17.75M. But
that’s not the whole story. As noted in previous posts, this figure is in part
composed of the monies owed to the companies by their debtors. It bears
repeating that this is work that has been carried out, but has yet to be paid
for, and in uncertain financial conditions may never be paid. For this reason,
I’ve introduced a simple calculation to demonstrate the percentage of the
Current Assets that are composed of unsecured debtor value. Of the 19 companies
who submitted accounts in 2014, and are still listed as active, this figure
ranged from 0% to 189.16%, with the mean being 55.18%. This may be compared to the 18 Active
companies who submitted 2015 accounts. Here the figures ranged from 0% to
97.62%, with an average of 47.48%. While still relatively high, the situation
does appear to be improving in this regard. The final KFI is, of course, the
summed Net Worth of the sector. The 2015 figure is €3.07M and it is the first time
since 2008 (€12.51M) where it is an increase on the previous year. While it may
be seized on as a positive sign, and an indicator of steps towards prosperity,
I would caution that it is a single year’s results that could yet go either
way.
Mega-fauna
Taken together, the
KFIs are mostly going in the right direction. Net Worth, Current Assets, etc.
are all improving, while levels of debt appear to be under control. Probably
even more importantly, the average percentage of Debtor value that makes up
part of the Current Assets calculation appears to be at manageable levels and
has decreased since last year. This looks like an industry on the cusp of a
full recovery. Even the fact that there are 18 companies dividing the sector
between them appears to give the impression of vibrancy. But that’s not really
the case. In my
previous post on the financial histories of the Irish consultancies I noted
that the years 2008 and 2009 would appear to be “nothing less than an
extinction-level event for the Irish commercial archaeological sector”. In that
time a significant number of the large consultancies either shut up shop, or
were vastly reduced in their circumstances. While some of smaller companies
have emerged and adapted to fill the financial niche, the sector is still dominated
by a just one “great predator”. To give
an indication of how much this one company (who I shan’t name, but we all know
which one it is) dominates the Irish scene, I have reconfigured the datasource
to show all the other currently Active companies combined into a single entity.
You’ll find the dashboard under the ‘Mega-fauna’ tab.
In terms of Fixed
Assets, the One Company had €235K in 2015, as opposed to €706K for the
rest. This is hardly surprising as each of the smaller companies have to
provide their own premises, vehicles, and digging equipment etc., resulting in significant
duplications. Again, in terms of Stock/Other assets and investments, One Company
has a 2015 result of €70K, far below the €997K of the combined others. The
breakdown of the Debtors is interesting – this One enterprise returned a 2015
total of €908K, not far below the €958K of Everyone Else. To put that another
way – of all the money that is owed to Irish archaeological consultancies,
almost 49% of it is owed to this One Company. This One Company has a 2015 Cash
at Bank total of €1.87M, in stark contrast to the €965K of Everyone Else –
that’s almost exactly two-thirds of the current Cash holdings belonging to a
single entity. When it comes to the Current Liabilities payable within one
year, this One Company returned a figure of -€523K, against the -€1.53M for the
combined rest of the sector. Again, putting that in context, of all the
short-term debt in the sector, this one consultancy holds slightly more than
25%. The situation is even starker when we examine the figures for Creditors to
be paid back at a term greater than one year. The 2015 figure for Everyone Else
is -€571K, while the One Company has no long term debt, and appears not to have
had since 2009. The gross Current Assets show this One group with a total for
2015 of €2.85M, just behind the €2.92M for Everyone Else. Again, this shows
that 49% of the total value for the sector is tied up in one company. It is
also worthwhile noting that the percentage of the Current Assets made up of
Debtors is 31.9% at this one firm, very slightly better than the 32.8% for the
combined remainder of the sector. Finally, the Net Worth variable indicates
that one company recorded a value of €1.58M in 2015, slightly ahead of the
€1.49M for the combined rest of the companies. Think about that for a second –
just over half (51%) of the Net Worth of the entire sector is held by a single
entity. My original comment from when I first examined this data was that “In
short, this one company is the most cash rich, is worth more, has more assets,
and fewer debts than the rest of the sector combined.” In the time since I made
that statement the only thing that has changed is the relative value of their
Fixed Assets. One other point that I’d like to draw from the relative Net Worth
graph is how this one company has fared in relation to the rest of the sector.
The Everyone Else line shows Net Worth rising to a peak of €11.3M in 2008, and
falling every year to €790K in 2014. Thus, 2015s total is the first time in
eight years where their Net Worth actually increased over the previous year’s
result. By contrast, the trajectory taken by this enterprise is one of steadily
increasing Net Worth from their first available set of accounts in 2006 (€405K)
to a peak of €1.77M in 2012. Their results in the years since are all
comfortably in the €1.5M range. The implication to be taken here is that when
the rest of the sector was doing well, they were too. But when the sector went
into post-2008 freefall they managed to effectively insulate themselves from
it. When everyone else is either a dinosaur that evolved into birds, or furry
little mammals filling the vacant spaces, this is the dino that ducked the
meteor.
 |
| Net Worth for One Company vs Everyone Else. Tableau Dashboard [here] |
When faced with a large
beast marauding the landscape there are two routes that are available to the
individual. You can stay on your own and you will, in all probability, get
devoured by the creature. The other option is to band together for mutual
protection and defence. We know that in the past this included digging ditches,
putting up banks and palisaded fences, but we don’t quite need to do that
today. Instead, I have a simple plea to all current or aspiring archaeologists
in Ireland – both north and south – if you’re still working in the field and
would like to see the profession continue your choice is simple: go join the
Unite Union. The Facebook page Unite Archaeologists -
Digging for a Living Wage is your best starting point and will guide you
through the simple process of becoming a Union member. It is only when members
of the profession stand together that they can protect themselves from the predations
of large companies that control the market and ensure that a healthy and fair
profession develops. Once people are organised and motivated – with palisades
built and ditches dug – that’s when they go hunting for monsters …
Notes
For the best viewing experience of the Tableau dashboard, I would recommend going to Full Screen mode (F11) … there will be less scrolling needed!
Access the dashboard directly at the Tableau server here.
The first part of the title of this post is taken from the song ‘Dig’ by NOFX from their 1994 album Punk in Drublic. But, of course, you knew that.


Comments
Post a Comment